What is it?
A Cozy Living Room of an Internet Board
http://illuminati-r-us.com/forums/
Lance wrote:A graph?
Lance wrote:Really, that's all you wanted?
MM_Dandy wrote:The percentage of the world's population which holds 1% of the wealth?
MM_Dandy wrote:The percentage of the world's population which holds 1% of the wealth?
Lance wrote:No, I'm sure it's erections. Look:
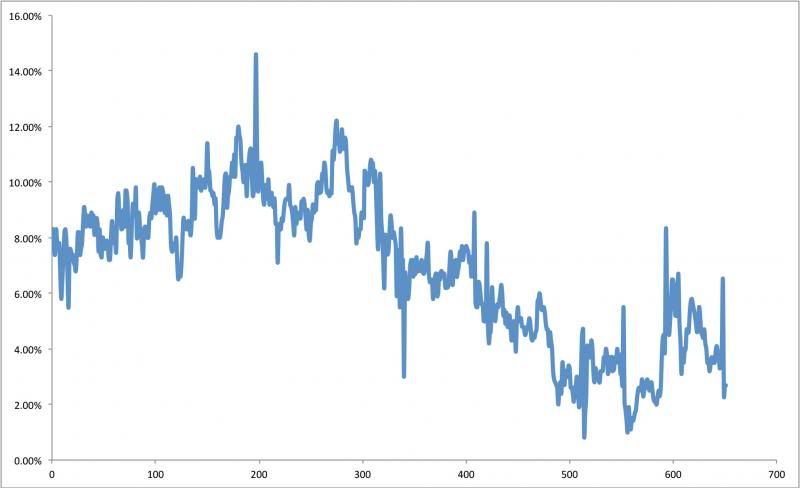
The period from 0 to 200 is the onset of puberty to the age of 21. Then from there to 600 describes age 21 to 40. Then the discovery of Viagra happens and we have the new peak.
Мастер wrote:MM_Dandy wrote:The percentage of the world's population which holds 1% of the wealth?
Assuming you mean the top percentile which owns 1% of the world's wealth, it should be less than 1%.
It is a financial time series, and the source was the US Department of Commerce. I don't expect that they track the phenomenon Llance is describing (although I haven't checked, maybe they do).
tubeswell wrote:Which more-or-less translates to what MM Dandy suggested I guess.
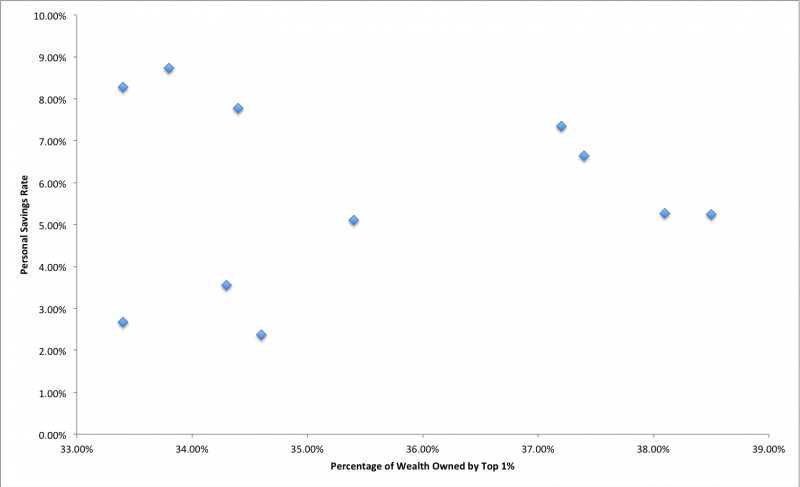
tubeswell wrote:Fewer people are able to save more money.
tubeswell wrote:Did I mention Americans? Why equate Americans with the top 1%?
tubeswell wrote:Besides that, just because the top 1% don't put the money in a savings bank, doesn't mean they wouldn't have got it invested somehow