Guess what the Graph Shows!
Re: Guess what the Graph Shows!
![]() by Мастер » Fri Mar 20, 2015 3:11 pm
by Мастер » Fri Mar 20, 2015 3:11 pm
-

Мастер - Moderator

- Злой Мудак
- Mauerspecht
- Posts: 23935
- Joined: Tue Aug 02, 2005 2:56 pm
- Location: Far from Damascus
Re: Guess what the Graph Shows!
![]() by Lianachan » Fri Mar 20, 2015 3:16 pm
by Lianachan » Fri Mar 20, 2015 3:16 pm
-

Lianachan - Enlightened One

- Tits and Nazis though.... Worth investigating
- Posts: 8785
- Joined: Fri Mar 05, 2010 5:12 pm
- Location: A' Ghàidhealtachd, Alba
Re: Guess what the Graph Shows!
![]() by Мастер » Fri Mar 20, 2015 3:18 pm
by Мастер » Fri Mar 20, 2015 3:18 pm
Lianachan wrote:Ooh! Good guess.
I didn't check the timing of the eclipse when I made my guess, but I just checked now. It does seem to fit.
-
Мастер - Moderator
- Злой Мудак
- Mauerspecht
- Posts: 23935
- Joined: Tue Aug 02, 2005 2:56 pm
- Location: Far from Damascus
Re: Guess what the Graph Shows!
![]() by Arneb » Fri Mar 20, 2015 7:33 pm
by Arneb » Fri Mar 20, 2015 7:33 pm
It is actually Solar energy production in Germany, projected for today, provieded it was cloudless everywhere. There was a big panic mongering from the right side of the spectrum, alleging that our electricity grid would totally collapse because of the rapid change in electricity generatede, and all just because of those idiotic Greens and their stupid championing of Solar power.
I am writing this from a computer plugged into the wall, btw. And no, we do not have an emergency diesel generator.
On to you, Mactep.
-

Arneb - Moderator
- German Medical Dude
- God of All Things IT
- Posts: 70074
- Joined: Thu Nov 23, 2006 8:22 pm
- Location: Potsdam, Germany
-
Мастер - Moderator
- Злой Мудак
- Mauerspecht
- Posts: 23935
- Joined: Tue Aug 02, 2005 2:56 pm
- Location: Far from Damascus
Re: Guess what the Graph Shows!
![]() by Мастер » Mon Jun 29, 2015 12:28 am
by Мастер » Mon Jun 29, 2015 12:28 am
The horizontal axis would be time.
-
Мастер - Moderator
- Злой Мудак
- Mauerspecht
- Posts: 23935
- Joined: Tue Aug 02, 2005 2:56 pm
- Location: Far from Damascus
Re: Guess what the Graph Shows!
![]() by Arneb » Mon Jun 29, 2015 5:50 am
by Arneb » Mon Jun 29, 2015 5:50 am
-
Arneb - Moderator
- German Medical Dude
- God of All Things IT
- Posts: 70074
- Joined: Thu Nov 23, 2006 8:22 pm
- Location: Potsdam, Germany
Re: Guess what the Graph Shows!
![]() by Мастер » Mon Jun 29, 2015 6:27 am
by Мастер » Mon Jun 29, 2015 6:27 am
Arneb wrote:OK, wild-ass guess. The Dow Jones index, since its inception?
No, that would need a relatively flat area over on the right.
The period of time covered is quite a bit longer than the time since the creation of the Dow Jones index.
-
Мастер - Moderator
- Злой Мудак
- Mauerspecht
- Posts: 23935
- Joined: Tue Aug 02, 2005 2:56 pm
- Location: Far from Damascus
Re: Guess what the Graph Shows!
![]() by Lance » Mon Jun 29, 2015 11:22 am
by Lance » Mon Jun 29, 2015 11:22 am
However, a large number of electrons were terribly inconvenienced.
==========================================
Build a man a fire and he will be warm for a few hours.
Set a man on fire and he will be warm for the rest of his life.
-

Lance - Administrator

- Cheeseburger Swilling Lard-Ass who needs to put down the remote and get off the couch.
- Posts: 91419
- Joined: Thu May 12, 2005 5:51 pm
- Location: Oswego, IL
Re: Guess what the Graph Shows!
![]() by Мастер » Mon Jun 29, 2015 11:37 am
by Мастер » Mon Jun 29, 2015 11:37 am
Lance wrote:CO2 levels and average global temperatures?
It is neither of those two things, although it is possible that there is a complex relation between those two things and what is shown in the graph. It is also possible that the causality is bi-directional; I lack sufficient (or really, any) expertise to say whether that is really the case.
-
Мастер - Moderator
- Злой Мудак
- Mauerspecht
- Posts: 23935
- Joined: Tue Aug 02, 2005 2:56 pm
- Location: Far from Damascus
Re: Guess what the Graph Shows!
![]() by Arneb » Mon Jun 29, 2015 3:37 pm
by Arneb » Mon Jun 29, 2015 3:37 pm
-
Arneb - Moderator
- German Medical Dude
- God of All Things IT
- Posts: 70074
- Joined: Thu Nov 23, 2006 8:22 pm
- Location: Potsdam, Germany
Re: Guess what the Graph Shows!
![]() by Lance » Mon Jun 29, 2015 4:58 pm
by Lance » Mon Jun 29, 2015 4:58 pm
However, a large number of electrons were terribly inconvenienced.
==========================================
Build a man a fire and he will be warm for a few hours.
Set a man on fire and he will be warm for the rest of his life.
-
Lance - Administrator
- Cheeseburger Swilling Lard-Ass who needs to put down the remote and get off the couch.
- Posts: 91419
- Joined: Thu May 12, 2005 5:51 pm
- Location: Oswego, IL
Re: Guess what the Graph Shows!
![]() by Мастер » Mon Jun 29, 2015 5:58 pm
by Мастер » Mon Jun 29, 2015 5:58 pm
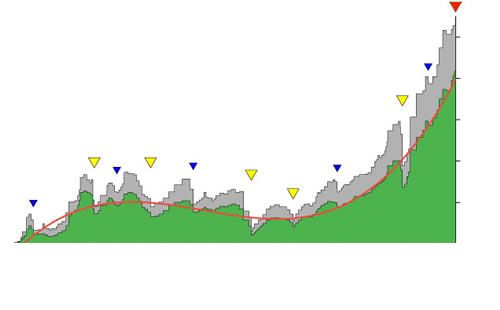
Arneb wrote:Maybe some measure of the number of extant species on Earth over the age of the planet? <wrong stuff skipped> The dents denoted by the yellow triangles would then denote the five great mass extinctions we've had.
Oh! So close!
So what is the next level of classification, above "species"?
-
Мастер - Moderator
- Злой Мудак
- Mauerspecht
- Posts: 23935
- Joined: Tue Aug 02, 2005 2:56 pm
- Location: Far from Damascus
Re: Guess what the Graph Shows!
![]() by Arneb » Mon Jun 29, 2015 7:20 pm
by Arneb » Mon Jun 29, 2015 7:20 pm
-
Arneb - Moderator
- German Medical Dude
- God of All Things IT
- Posts: 70074
- Joined: Thu Nov 23, 2006 8:22 pm
- Location: Potsdam, Germany
Re: Guess what the Graph Shows!
![]() by Lance » Mon Jun 29, 2015 11:41 pm
by Lance » Mon Jun 29, 2015 11:41 pm
However, a large number of electrons were terribly inconvenienced.
==========================================
Build a man a fire and he will be warm for a few hours.
Set a man on fire and he will be warm for the rest of his life.
-
Lance - Administrator
- Cheeseburger Swilling Lard-Ass who needs to put down the remote and get off the couch.
- Posts: 91419
- Joined: Thu May 12, 2005 5:51 pm
- Location: Oswego, IL
Re: Guess what the Graph Shows!
![]() by Мастер » Tue Jun 30, 2015 1:46 am
by Мастер » Tue Jun 30, 2015 1:46 am
Arneb wrote:Genera, then.
Most excellent! Have a look at the original, near the bottom.
https://en.wikipedia.org/wiki/Phanerozoic
-
Мастер - Moderator
- Злой Мудак
- Mauerspecht
- Posts: 23935
- Joined: Tue Aug 02, 2005 2:56 pm
- Location: Far from Damascus
Re: Guess what the Graph Shows!
![]() by Arneb » Tue Jun 30, 2015 5:48 am
by Arneb » Tue Jun 30, 2015 5:48 am
Let me think of something.
-
Arneb - Moderator
- German Medical Dude
- God of All Things IT
- Posts: 70074
- Joined: Thu Nov 23, 2006 8:22 pm
- Location: Potsdam, Germany
Re: Guess what the Graph Shows!
![]() by Мастер » Tue Jun 30, 2015 6:08 am
by Мастер » Tue Jun 30, 2015 6:08 am
Arneb wrote:Thanks for not discounting my post for mixing up the age of the Earth with the duration of the phanerozoic (about 1/8 of the total age of the Earth!).;
I figured you had captured the essential idea.
-
Мастер - Moderator
- Злой Мудак
- Mauerspecht
- Posts: 23935
- Joined: Tue Aug 02, 2005 2:56 pm
- Location: Far from Damascus
Re: Guess what the Graph Shows!
![]() by Arneb » Tue Jul 07, 2015 7:57 pm
by Arneb » Tue Jul 07, 2015 7:57 pm
-
Arneb - Moderator
- German Medical Dude
- God of All Things IT
- Posts: 70074
- Joined: Thu Nov 23, 2006 8:22 pm
- Location: Potsdam, Germany
Re: Guess what the Graph Shows!
![]() by Lianachan » Fri Aug 28, 2015 10:17 am
by Lianachan » Fri Aug 28, 2015 10:17 am
-
Lianachan - Enlightened One
- Tits and Nazis though.... Worth investigating
- Posts: 8785
- Joined: Fri Mar 05, 2010 5:12 pm
- Location: A' Ghàidhealtachd, Alba
Re: Guess what the Graph Shows!
![]() by Arneb » Fri Aug 28, 2015 12:42 pm
by Arneb » Fri Aug 28, 2015 12:42 pm
-
Arneb - Moderator
- German Medical Dude
- God of All Things IT
- Posts: 70074
- Joined: Thu Nov 23, 2006 8:22 pm
- Location: Potsdam, Germany
Re: Guess what the Graph Shows!
![]() by Мастер » Fri Aug 28, 2015 5:24 pm
by Мастер » Fri Aug 28, 2015 5:24 pm
-
Мастер - Moderator
- Злой Мудак
- Mauerspecht
- Posts: 23935
- Joined: Tue Aug 02, 2005 2:56 pm
- Location: Far from Damascus
Re: Guess what the Graph Shows!
![]() by Arneb » Fri Aug 28, 2015 5:37 pm
by Arneb » Fri Aug 28, 2015 5:37 pm
-
Arneb - Moderator
- German Medical Dude
- God of All Things IT
- Posts: 70074
- Joined: Thu Nov 23, 2006 8:22 pm
- Location: Potsdam, Germany
Re: Guess what the Graph Shows!
![]() by Arneb » Tue Sep 01, 2015 8:29 am
by Arneb » Tue Sep 01, 2015 8:29 am
-
Arneb - Moderator
- German Medical Dude
- God of All Things IT
- Posts: 70074
- Joined: Thu Nov 23, 2006 8:22 pm
- Location: Potsdam, Germany
Re: Guess what the Graph Shows!
![]() by Мастер » Tue Sep 01, 2015 9:34 am
by Мастер » Tue Sep 01, 2015 9:34 am
Arneb wrote:One of the researchers involved in the data gathering is reputed to have said that he felt like looking at the face of God when he saw the graph. So yeah, this smooth curve does have significance.
I was thinking that the horizontal axis might be time measured in hours, but the above comment has me thinking along different lines now.
-
Мастер - Moderator
- Злой Мудак
- Mauerspecht
- Posts: 23935
- Joined: Tue Aug 02, 2005 2:56 pm
- Location: Far from Damascus
Who is online
Users browsing this forum: Google [Bot] and 123 guests