Lance wrote:Мастер wrote:As per previous hint, it is the most up-to-date data set I could find.
Where did you look?
Guess what the Graph Shows!
Re: Guess what the Graph Shows!
![]() by Мастер » Fri Sep 11, 2015 6:33 am
by Мастер » Fri Sep 11, 2015 6:33 am
They call me Mr Celsius!
-

Мастер - Moderator

- Злой Мудак
- Mauerspecht
- Posts: 23936
- Joined: Tue Aug 02, 2005 2:56 pm
- Location: Far from Damascus
Re: Guess what the Graph Shows!
![]() by Arneb » Fri Sep 11, 2015 9:07 am
by Arneb » Fri Sep 11, 2015 9:07 am
Arneb wrote:Road traffic deaths in the U.S., the outlier being 2001 due to everyone using highways instead of flying (then, the last dot is 2013)?
So, today being Sept 11, how about my guess?
Non sunt multiplicanda entia praeter necessitatem
-

Arneb - Moderator
- German Medical Dude
- God of All Things IT
- Posts: 70080
- Joined: Thu Nov 23, 2006 8:22 pm
- Location: Potsdam, Germany
Re: Guess what the Graph Shows!
![]() by Мастер » Fri Sep 11, 2015 9:27 am
by Мастер » Fri Sep 11, 2015 9:27 am
Arneb wrote:Arneb wrote:Road traffic deaths in the U.S., the outlier being 2001 due to everyone using highways instead of flying (then, the last dot is 2013)?
So, today being Sept 11, how about my guess?
I missed your earlier post.
It is not road traffic deaths, but you are not all that far off now . . . looking for more direct effects than indirect effects.
They call me Mr Celsius!
-
Мастер - Moderator
- Злой Мудак
- Mauerspecht
- Posts: 23936
- Joined: Tue Aug 02, 2005 2:56 pm
- Location: Far from Damascus
Re: Guess what the Graph Shows!
![]() by Arneb » Fri Sep 11, 2015 11:44 am
by Arneb » Fri Sep 11, 2015 11:44 am
Deaths in the U.S. due to violent crime then?
Non sunt multiplicanda entia praeter necessitatem
-
Arneb - Moderator
- German Medical Dude
- God of All Things IT
- Posts: 70080
- Joined: Thu Nov 23, 2006 8:22 pm
- Location: Potsdam, Germany
Re: Guess what the Graph Shows!
![]() by Мастер » Fri Sep 11, 2015 1:02 pm
by Мастер » Fri Sep 11, 2015 1:02 pm
Arneb wrote:Deaths in the U.S. due to violent crime then?
That's extremely close to correct.
It is murders (I guess there are deaths due to violent crime other than murder, although I'm not completely sure whether that is the definition used by my source). Deaths due to terrorism were not included, so I had to add them in separately. The only year in which that would have made a visually detectable difference was in 2001, the outlier that has been noticed. Note also that this outlier is still well below the level just a few years before, and for a while before that.
They call me Mr Celsius!
-
Мастер - Moderator
- Злой Мудак
- Mauerspecht
- Posts: 23936
- Joined: Tue Aug 02, 2005 2:56 pm
- Location: Far from Damascus
Re: Guess what the Graph Shows!
![]() by Lance » Fri Sep 11, 2015 1:35 pm
by Lance » Fri Sep 11, 2015 1:35 pm
Мастер wrote:It is murders (I guess there are deaths due to violent crime other than murder, although I'm not completely sure whether that is the definition used by my source).
A lot of it is the way it's phrased. In some jurisdictions you have 1st Degree Murder, 2nd Degree Murder and 3rd Degree Murder. All considered murders. In other jurisdictions you have Murder, Voluntary Manslaughter and Involuntary Manslaughter. These are functionally the same but forgo the word "Murder". You also have, for example, a death caused by a drunk driver commonly referred to as Vehicular Homicide. A violent crime for sure, but still not a murder. All murders are homicides but not all homicides are murders.
So your comment about the definition being unclear is very on point.
No trees were killed in the posting of this message.
However, a large number of electrons were terribly inconvenienced.
==========================================
Build a man a fire and he will be warm for a few hours.
Set a man on fire and he will be warm for the rest of his life.
However, a large number of electrons were terribly inconvenienced.
==========================================
Build a man a fire and he will be warm for a few hours.
Set a man on fire and he will be warm for the rest of his life.
-

Lance - Administrator

- Cheeseburger Swilling Lard-Ass who needs to put down the remote and get off the couch.
- Posts: 91419
- Joined: Thu May 12, 2005 5:51 pm
- Location: Oswego, IL
Re: Guess what the Graph Shows!
![]() by Arneb » Sat Sep 12, 2015 10:17 am
by Arneb » Sat Sep 12, 2015 10:17 am
OK, here's the new one. I could go on and on about it, but let's first see if you find out what it means 
Non sunt multiplicanda entia praeter necessitatem
-
Arneb - Moderator
- German Medical Dude
- God of All Things IT
- Posts: 70080
- Joined: Thu Nov 23, 2006 8:22 pm
- Location: Potsdam, Germany
Re: Guess what the Graph Shows!
![]() by Мастер » Sat Sep 12, 2015 2:20 pm
by Мастер » Sat Sep 12, 2015 2:20 pm
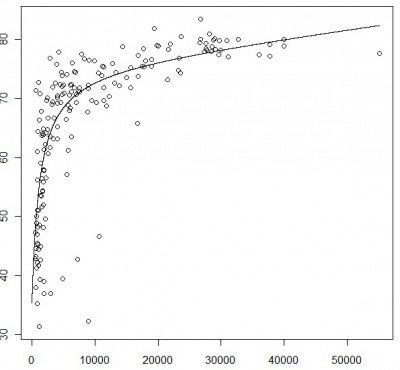
Is the vertical axis, age?
They call me Mr Celsius!
-
Мастер - Moderator
- Злой Мудак
- Mauerspecht
- Posts: 23936
- Joined: Tue Aug 02, 2005 2:56 pm
- Location: Far from Damascus
Re: Guess what the Graph Shows!
![]() by Arneb » Sat Sep 12, 2015 3:58 pm
by Arneb » Sat Sep 12, 2015 3:58 pm
Yup
Non sunt multiplicanda entia praeter necessitatem
-
Arneb - Moderator
- German Medical Dude
- God of All Things IT
- Posts: 70080
- Joined: Thu Nov 23, 2006 8:22 pm
- Location: Potsdam, Germany
Re: Guess what the Graph Shows!
![]() by Мастер » Sat Sep 12, 2015 9:36 pm
by Мастер » Sat Sep 12, 2015 9:36 pm
So I'd say its prevalence of some condition (perhaps being dead) at various ages.
They call me Mr Celsius!
-
Мастер - Moderator
- Злой Мудак
- Mauerspecht
- Posts: 23936
- Joined: Tue Aug 02, 2005 2:56 pm
- Location: Far from Damascus
Re: Guess what the Graph Shows!
![]() by Arneb » Sat Sep 12, 2015 9:59 pm
by Arneb » Sat Sep 12, 2015 9:59 pm
No. Plotting the chart you describe, wouldn't age usually appear on the x-axis?
Non sunt multiplicanda entia praeter necessitatem
-
Arneb - Moderator
- German Medical Dude
- God of All Things IT
- Posts: 70080
- Joined: Thu Nov 23, 2006 8:22 pm
- Location: Potsdam, Germany
Re: Guess what the Graph Shows!
![]() by Мастер » Sat Sep 12, 2015 10:08 pm
by Мастер » Sat Sep 12, 2015 10:08 pm
It would, although truth be told, I'm having difficulty thinking of any graph where you would have age on the vertical axis. Usually people know how old they are.
They call me Mr Celsius!
-
Мастер - Moderator
- Злой Мудак
- Mauerspecht
- Posts: 23936
- Joined: Tue Aug 02, 2005 2:56 pm
- Location: Far from Damascus
Re: Guess what the Graph Shows!
![]() by Lance » Sat Sep 12, 2015 10:24 pm
by Lance » Sat Sep 12, 2015 10:24 pm
Interesting... If I tried to quote the message to bring the graph to this page it wouldn't show up. I had to do it as a new image.
No trees were killed in the posting of this message.
However, a large number of electrons were terribly inconvenienced.
==========================================
Build a man a fire and he will be warm for a few hours.
Set a man on fire and he will be warm for the rest of his life.
However, a large number of electrons were terribly inconvenienced.
==========================================
Build a man a fire and he will be warm for a few hours.
Set a man on fire and he will be warm for the rest of his life.
-
Lance - Administrator
- Cheeseburger Swilling Lard-Ass who needs to put down the remote and get off the couch.
- Posts: 91419
- Joined: Thu May 12, 2005 5:51 pm
- Location: Oswego, IL
Re: Guess what the Graph Shows!
![]() by Arneb » Sat Sep 12, 2015 11:08 pm
by Arneb » Sat Sep 12, 2015 11:08 pm
Мастер wrote:It would, although truth be told, I'm having difficulty thinking of any graph where you would have age on the vertical axis. Usually people know how old they are.
Is that so odd? It shows age as a function of something. Like, the age you lose your virginity as a funtion of how many porn movies you've watched. if that were the graph (which it isn't, of course), people who had watched more than around 10,000 porn films would, by and large, have had their first sex at 70.
But you are right. It's not age, it's "age at which something happens". That something remains to be elucidated.
Lance, I uploaded the graphic through the normal "upload attachment" routine. When I did, it didn't behave strangely.
Non sunt multiplicanda entia praeter necessitatem
-
Arneb - Moderator
- German Medical Dude
- God of All Things IT
- Posts: 70080
- Joined: Thu Nov 23, 2006 8:22 pm
- Location: Potsdam, Germany
Re: Guess what the Graph Shows!
![]() by Lance » Sat Sep 12, 2015 11:15 pm
by Lance » Sat Sep 12, 2015 11:15 pm
Arneb wrote:Lance, I uploaded the graphic through the normal "upload attachment" routine. When I did, it didn't behave strangely.
It's fine. It just seems odd to me that I can't quote it.
No trees were killed in the posting of this message.
However, a large number of electrons were terribly inconvenienced.
==========================================
Build a man a fire and he will be warm for a few hours.
Set a man on fire and he will be warm for the rest of his life.
However, a large number of electrons were terribly inconvenienced.
==========================================
Build a man a fire and he will be warm for a few hours.
Set a man on fire and he will be warm for the rest of his life.
-
Lance - Administrator
- Cheeseburger Swilling Lard-Ass who needs to put down the remote and get off the couch.
- Posts: 91419
- Joined: Thu May 12, 2005 5:51 pm
- Location: Oswego, IL
Re: Guess what the Graph Shows!
![]() by Arneb » Tue Sep 15, 2015 6:44 pm
by Arneb » Tue Sep 15, 2015 6:44 pm
The age is really an age at which something VERY IMPORTANT happens.
Non sunt multiplicanda entia praeter necessitatem
-
Arneb - Moderator
- German Medical Dude
- God of All Things IT
- Posts: 70080
- Joined: Thu Nov 23, 2006 8:22 pm
- Location: Potsdam, Germany
Re: Guess what the Graph Shows!
![]() by Lance » Tue Sep 15, 2015 8:03 pm
by Lance » Tue Sep 15, 2015 8:03 pm
Like, death?
No trees were killed in the posting of this message.
However, a large number of electrons were terribly inconvenienced.
==========================================
Build a man a fire and he will be warm for a few hours.
Set a man on fire and he will be warm for the rest of his life.
However, a large number of electrons were terribly inconvenienced.
==========================================
Build a man a fire and he will be warm for a few hours.
Set a man on fire and he will be warm for the rest of his life.
-
Lance - Administrator
- Cheeseburger Swilling Lard-Ass who needs to put down the remote and get off the couch.
- Posts: 91419
- Joined: Thu May 12, 2005 5:51 pm
- Location: Oswego, IL
Re: Guess what the Graph Shows!
![]() by Arneb » Tue Sep 15, 2015 8:06 pm
by Arneb » Tue Sep 15, 2015 8:06 pm
Fuck yeah - it's life expectancy folks!
Non sunt multiplicanda entia praeter necessitatem
-
Arneb - Moderator
- German Medical Dude
- God of All Things IT
- Posts: 70080
- Joined: Thu Nov 23, 2006 8:22 pm
- Location: Potsdam, Germany
Re: Guess what the Graph Shows!
![]() by Lance » Tue Sep 15, 2015 8:36 pm
by Lance » Tue Sep 15, 2015 8:36 pm
But we still need the X axis, right?
No trees were killed in the posting of this message.
However, a large number of electrons were terribly inconvenienced.
==========================================
Build a man a fire and he will be warm for a few hours.
Set a man on fire and he will be warm for the rest of his life.
However, a large number of electrons were terribly inconvenienced.
==========================================
Build a man a fire and he will be warm for a few hours.
Set a man on fire and he will be warm for the rest of his life.
-
Lance - Administrator
- Cheeseburger Swilling Lard-Ass who needs to put down the remote and get off the couch.
- Posts: 91419
- Joined: Thu May 12, 2005 5:51 pm
- Location: Oswego, IL
Re: Guess what the Graph Shows!
![]() by Arneb » Tue Sep 15, 2015 9:19 pm
by Arneb » Tue Sep 15, 2015 9:19 pm
Oh yes you do.
Non sunt multiplicanda entia praeter necessitatem
-
Arneb - Moderator
- German Medical Dude
- God of All Things IT
- Posts: 70080
- Joined: Thu Nov 23, 2006 8:22 pm
- Location: Potsdam, Germany
Re: Guess what the Graph Shows!
![]() by Lance » Tue Sep 15, 2015 9:58 pm
by Lance » Tue Sep 15, 2015 9:58 pm
So do I interpret it correctly that, the more X they have the longer they live?
No trees were killed in the posting of this message.
However, a large number of electrons were terribly inconvenienced.
==========================================
Build a man a fire and he will be warm for a few hours.
Set a man on fire and he will be warm for the rest of his life.
However, a large number of electrons were terribly inconvenienced.
==========================================
Build a man a fire and he will be warm for a few hours.
Set a man on fire and he will be warm for the rest of his life.
-
Lance - Administrator
- Cheeseburger Swilling Lard-Ass who needs to put down the remote and get off the couch.
- Posts: 91419
- Joined: Thu May 12, 2005 5:51 pm
- Location: Oswego, IL
Re: Guess what the Graph Shows!
![]() by Arneb » Wed Sep 16, 2015 5:59 pm
by Arneb » Wed Sep 16, 2015 5:59 pm
That would be so, yes.
And the line represents a best fit for the data points.
And the line represents a best fit for the data points.
Non sunt multiplicanda entia praeter necessitatem
-
Arneb - Moderator
- German Medical Dude
- God of All Things IT
- Posts: 70080
- Joined: Thu Nov 23, 2006 8:22 pm
- Location: Potsdam, Germany
Re: Guess what the Graph Shows!
![]() by Lance » Wed Sep 16, 2015 6:26 pm
by Lance » Wed Sep 16, 2015 6:26 pm
Does whatever 'X' represents actually have an 'x' in it?
No trees were killed in the posting of this message.
However, a large number of electrons were terribly inconvenienced.
==========================================
Build a man a fire and he will be warm for a few hours.
Set a man on fire and he will be warm for the rest of his life.
However, a large number of electrons were terribly inconvenienced.
==========================================
Build a man a fire and he will be warm for a few hours.
Set a man on fire and he will be warm for the rest of his life.
-
Lance - Administrator
- Cheeseburger Swilling Lard-Ass who needs to put down the remote and get off the couch.
- Posts: 91419
- Joined: Thu May 12, 2005 5:51 pm
- Location: Oswego, IL
Re: Guess what the Graph Shows!
![]() by Arneb » Wed Sep 16, 2015 6:49 pm
by Arneb » Wed Sep 16, 2015 6:49 pm
No.
Non sunt multiplicanda entia praeter necessitatem
-
Arneb - Moderator
- German Medical Dude
- God of All Things IT
- Posts: 70080
- Joined: Thu Nov 23, 2006 8:22 pm
- Location: Potsdam, Germany
Re: Guess what the Graph Shows!
![]() by Lance » Wed Sep 16, 2015 7:08 pm
by Lance » Wed Sep 16, 2015 7:08 pm
Damn! I was looking for a reason to convince Cyndi to have more X with me.
No trees were killed in the posting of this message.
However, a large number of electrons were terribly inconvenienced.
==========================================
Build a man a fire and he will be warm for a few hours.
Set a man on fire and he will be warm for the rest of his life.
However, a large number of electrons were terribly inconvenienced.
==========================================
Build a man a fire and he will be warm for a few hours.
Set a man on fire and he will be warm for the rest of his life.
-
Lance - Administrator
- Cheeseburger Swilling Lard-Ass who needs to put down the remote and get off the couch.
- Posts: 91419
- Joined: Thu May 12, 2005 5:51 pm
- Location: Oswego, IL
Who is online
Users browsing this forum: No registered users and 254 guests