Guess what the Graph Shows!
Re: Guess what the Graph Shows!
![]() by Мастер » Mon Oct 20, 2014 5:40 am
by Мастер » Mon Oct 20, 2014 5:40 am
-

Мастер - Moderator

- Злой Мудак
- Mauerspecht
- Posts: 23950
- Joined: Tue Aug 02, 2005 2:56 pm
- Location: Far from Damascus
Re: Guess what the Graph Shows!
![]() by tubeswell » Mon Oct 20, 2014 7:08 am
by tubeswell » Mon Oct 20, 2014 7:08 am
Мастер wrote:I have a really hard time trying to come up with reasons why that's close . . .
cos if you squint really hard it kinda looks like this?

If you are seeing an apparent paradox, that means you are missing something.
-

tubeswell - Enlightened One

- Posts: 324867
- Joined: Sun Sep 19, 2010 11:51 am
- Location: 129th in-line to the Llama Throne (after the last purge)
Re: Guess what the Graph Shows!
![]() by Мастер » Mon Oct 20, 2014 7:16 am
by Мастер » Mon Oct 20, 2014 7:16 am
-
Мастер - Moderator
- Злой Мудак
- Mauerspecht
- Posts: 23950
- Joined: Tue Aug 02, 2005 2:56 pm
- Location: Far from Damascus
Re: Guess what the Graph Shows!
![]() by Lianachan » Mon Oct 20, 2014 8:44 am
by Lianachan » Mon Oct 20, 2014 8:44 am
Мастер wrote:
The top axis is the day of the working week, the lower axis is the number of impossible things I still have to complete that week and the Y axis is the number of fucks I give about it all?
-

Lianachan - Enlightened One
- Tits and Nazis though.... Worth investigating
- Posts: 8820
- Joined: Fri Mar 05, 2010 5:12 pm
- Location: A' Ghàidhealtachd, Alba
Re: Guess what the Graph Shows!
![]() by tubeswell » Mon Oct 20, 2014 2:16 pm
by tubeswell » Mon Oct 20, 2014 2:16 pm
Lianachan wrote:Мастер wrote:
The top axis is the day of the working week, the lower axis is the number of impossible things I still have to complete that week and the Y axis is the number of fucks I give about it all?
I vote for this!
If you are seeing an apparent paradox, that means you are missing something.
-
tubeswell - Enlightened One
- Posts: 324867
- Joined: Sun Sep 19, 2010 11:51 am
- Location: 129th in-line to the Llama Throne (after the last purge)
Re: Guess what the Graph Shows!
![]() by Lianachan » Mon Oct 20, 2014 2:42 pm
by Lianachan » Mon Oct 20, 2014 2:42 pm
tubeswell wrote:Lianachan wrote:Мастер wrote:
The top axis is the day of the working week, the lower axis is the number of impossible things I still have to complete that week and the Y axis is the number of fucks I give about it all?
I vote for this!
I'm pretty sure it's right. Oh, the green is with coffee and the red is without coffee.
-
Lianachan - Enlightened One
- Tits and Nazis though.... Worth investigating
- Posts: 8820
- Joined: Fri Mar 05, 2010 5:12 pm
- Location: A' Ghàidhealtachd, Alba
Re: Guess what the Graph Shows!
![]() by Мастер » Wed Oct 29, 2014 4:04 pm
by Мастер » Wed Oct 29, 2014 4:04 pm
-
Мастер - Moderator
- Злой Мудак
- Mauerspecht
- Posts: 23950
- Joined: Tue Aug 02, 2005 2:56 pm
- Location: Far from Damascus
Re: Guess what the Graph Shows!
![]() by tubeswell » Wed Oct 29, 2014 4:55 pm
by tubeswell » Wed Oct 29, 2014 4:55 pm
If you are seeing an apparent paradox, that means you are missing something.
-
tubeswell - Enlightened One
- Posts: 324867
- Joined: Sun Sep 19, 2010 11:51 am
- Location: 129th in-line to the Llama Throne (after the last purge)
Re: Guess what the Graph Shows!
![]() by Arneb » Wed Oct 29, 2014 6:49 pm
by Arneb » Wed Oct 29, 2014 6:49 pm
-

Arneb - Moderator
- German Medical Dude
- God of All Things IT
- Posts: 70154
- Joined: Thu Nov 23, 2006 8:22 pm
- Location: Potsdam, Germany
Re: Guess what the Graph Shows!
![]() by Мастер » Wed Oct 29, 2014 9:13 pm
by Мастер » Wed Oct 29, 2014 9:13 pm
Arneb wrote:Would it be too much of a giveaway to tell us which unit the y axis has?
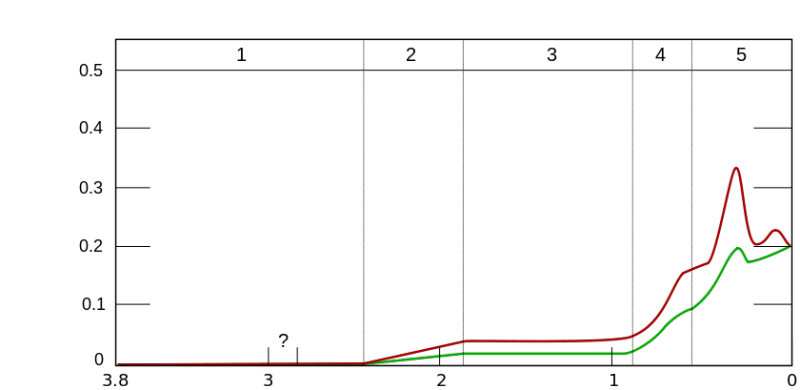
It is a fraction of a whole, so it has a theoretical minimum of zero and a maximum of one.
The two lines mark the upper and lower confidence bounds.
-
Мастер - Moderator
- Злой Мудак
- Mauerspecht
- Posts: 23950
- Joined: Tue Aug 02, 2005 2:56 pm
- Location: Far from Damascus
Re: Guess what the Graph Shows!
![]() by Мастер » Sat Nov 01, 2014 3:32 am
by Мастер » Sat Nov 01, 2014 3:32 am
-
Мастер - Moderator
- Злой Мудак
- Mauerspecht
- Posts: 23950
- Joined: Tue Aug 02, 2005 2:56 pm
- Location: Far from Damascus
Re: Guess what the Graph Shows!
![]() by Arneb » Sat Nov 01, 2014 6:58 pm
by Arneb » Sat Nov 01, 2014 6:58 pm
The numbers on the lower x-axis are billions of years, while the numbers on the upper one represent Ages of the Earth. Maybe the question mark is during the putative Snowball Earth period, and the red and green linees represent estimates of atmospheric oxygen content, conveniently converging at the just over 20 % mark we are seeing in the current era. The border between epochs 4 and 5 would then be the Precambiran/Cambrian transition, at a something like .55 Gy ago. And the "recent" spike would be some time during Cretacious, when, as I seem to recall foggily, there was a spike in atmospheric O2 reaching almost 40 %.
Does that even make sense?
-
Arneb - Moderator
- German Medical Dude
- God of All Things IT
- Posts: 70154
- Joined: Thu Nov 23, 2006 8:22 pm
- Location: Potsdam, Germany
Re: Guess what the Graph Shows!
![]() by Мастер » Sat Nov 01, 2014 11:56 pm
by Мастер » Sat Nov 01, 2014 11:56 pm
Arneb wrote:OK, let's try Big.
The numbers on the lower x-axis are billions of years, while the numbers on the upper one represent Ages of the Earth. Maybe the question mark is during the putative Snowball Earth period, and the red and green linees represent estimates of atmospheric oxygen content, conveniently converging at the just over 20 % mark we are seeing in the current era. The border between epochs 4 and 5 would then be the Precambiran/Cambrian transition, at a something like .55 Gy ago. And the "recent" spike would be some time during Cretacious, when, as I seem to recall foggily, there was a spike in atmospheric O2 reaching almost 40 %.
Does that even make sense?
Gut gemacht!
-
Мастер - Moderator
- Злой Мудак
- Mauerspecht
- Posts: 23950
- Joined: Tue Aug 02, 2005 2:56 pm
- Location: Far from Damascus
Re: Guess what the Graph Shows!
![]() by Lance » Sun Nov 02, 2014 6:50 am
by Lance » Sun Nov 02, 2014 6:50 am
Arneb wrote: there was a spike in atmospheric O2 reaching almost 40 %.
When the bugs got REAL BIG!
However, a large number of electrons were terribly inconvenienced.
==========================================
Build a man a fire and he will be warm for a few hours.
Set a man on fire and he will be warm for the rest of his life.
-

Lance - Administrator

- Cheeseburger Swilling Lard-Ass who needs to put down the remote and get off the couch.
- Posts: 91438
- Joined: Thu May 12, 2005 5:51 pm
- Location: Oswego, IL
Re: Guess what the Graph Shows!
![]() by Arneb » Mon Nov 03, 2014 8:47 pm
by Arneb » Mon Nov 03, 2014 8:47 pm
Lance wrote:Arneb wrote: there was a spike in atmospheric O2 reaching almost 40 %.
When the bugs got REAL BIG!
Yeah, they had dragonflies with one mete wingspans back then, and now that you've mentioned it, I think their existence was attributed to the high oxygen concentrations in the Cretaceous. Must have made for nice wildfires, too.
-
Arneb - Moderator
- German Medical Dude
- God of All Things IT
- Posts: 70154
- Joined: Thu Nov 23, 2006 8:22 pm
- Location: Potsdam, Germany
Re: Guess what the Graph Shows!
![]() by Arneb » Mon Nov 03, 2014 9:05 pm
by Arneb » Mon Nov 03, 2014 9:05 pm
From my field again.
-
Arneb - Moderator
- German Medical Dude
- God of All Things IT
- Posts: 70154
- Joined: Thu Nov 23, 2006 8:22 pm
- Location: Potsdam, Germany
Re: Guess what the Graph Shows!
![]() by Мастер » Mon Nov 03, 2014 11:04 pm
by Мастер » Mon Nov 03, 2014 11:04 pm
-
Мастер - Moderator
- Злой Мудак
- Mauerspecht
- Posts: 23950
- Joined: Tue Aug 02, 2005 2:56 pm
- Location: Far from Damascus
Re: Guess what the Graph Shows!
![]() by Lance » Tue Nov 04, 2014 2:03 am
by Lance » Tue Nov 04, 2014 2:03 am
Arneb wrote:Lance wrote:Arneb wrote: there was a spike in atmospheric O2 reaching almost 40 %.
When the bugs got REAL BIG!
Yeah, they had dragonflies with one mete wingspans back then, and now that you've mentioned it, I think their existence was attributed to the high oxygen concentrations in the Cretaceous. Must have made for nice wildfires, too.
Exactly. There's only so big an animal that respires through its exoskeleton can get. More oxygen available = bigger bug.
However, a large number of electrons were terribly inconvenienced.
==========================================
Build a man a fire and he will be warm for a few hours.
Set a man on fire and he will be warm for the rest of his life.
-
Lance - Administrator
- Cheeseburger Swilling Lard-Ass who needs to put down the remote and get off the couch.
- Posts: 91438
- Joined: Thu May 12, 2005 5:51 pm
- Location: Oswego, IL
Re: Guess what the Graph Shows!
![]() by Arneb » Tue Nov 04, 2014 9:34 pm
by Arneb » Tue Nov 04, 2014 9:34 pm
Мастер wrote:Is the horizontal axis age, and the vertical axis heart rate?
No to both, but age plays a role her. Note that by vertue of the different coulours, the plot contains three dimenions of information.
-
Arneb - Moderator
- German Medical Dude
- God of All Things IT
- Posts: 70154
- Joined: Thu Nov 23, 2006 8:22 pm
- Location: Potsdam, Germany
Re: Guess what the Graph Shows!
![]() by Arneb » Tue Nov 18, 2014 2:40 pm
by Arneb » Tue Nov 18, 2014 2:40 pm
The y axis is in percent. All bars add up to 100 %, counting all the subgroups.
The x axis counts years up to some recent date (2010) I think.
-
Arneb - Moderator
- German Medical Dude
- God of All Things IT
- Posts: 70154
- Joined: Thu Nov 23, 2006 8:22 pm
- Location: Potsdam, Germany
Re: Guess what the Graph Shows!
![]() by Heid the Ba » Tue Nov 18, 2014 3:19 pm
by Heid the Ba » Tue Nov 18, 2014 3:19 pm
Smoking?
-

Heid the Ba - Enlightened One
- Tree hugging, veggie, sandal wearing, pinko Euroweasel
- Mr. Sexy Ass
- Posts: 107650
- Joined: Wed Aug 02, 2006 12:20 pm
- Location: Edinburgh, Scotland
Re: Guess what the Graph Shows!
![]() by Arneb » Tue Nov 18, 2014 7:01 pm
by Arneb » Tue Nov 18, 2014 7:01 pm
Smoking, plausible, but no. The change is too quick for that. I must say, when I saw this graph I was rather struck by what it shows (the data, significantly, are for Germany, not, say, subsaharan Africa
 )
)-
Arneb - Moderator
- German Medical Dude
- God of All Things IT
- Posts: 70154
- Joined: Thu Nov 23, 2006 8:22 pm
- Location: Potsdam, Germany
-

MM_Dandy - Moderator
- King of Obscurity
- Posts: 4927
- Joined: Thu May 12, 2005 9:02 pm
- Location: Canton, SD, USA
Re: Guess what the Graph Shows!
![]() by Arneb » Wed Nov 19, 2014 6:49 am
by Arneb » Wed Nov 19, 2014 6:49 am
-
Arneb - Moderator
- German Medical Dude
- God of All Things IT
- Posts: 70154
- Joined: Thu Nov 23, 2006 8:22 pm
- Location: Potsdam, Germany
Re: Guess what the Graph Shows!
![]() by Heid the Ba » Wed Nov 19, 2014 9:08 am
by Heid the Ba » Wed Nov 19, 2014 9:08 am
-
Heid the Ba - Enlightened One
- Tree hugging, veggie, sandal wearing, pinko Euroweasel
- Mr. Sexy Ass
- Posts: 107650
- Joined: Wed Aug 02, 2006 12:20 pm
- Location: Edinburgh, Scotland
Who is online
Users browsing this forum: No registered users and 35 guests